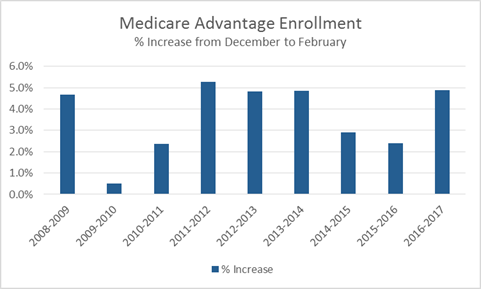
Medicare Advantage enrollments as of February 2017 reflected a higher year-end growth than the previous two years, and consistent with the percentage growth in 2013 and 2014. The table below shows that Medicare Advantage enrollments increased over 900,000 from December 2016 to February 2017, substantially higher than the growth in a count and percentage basis than the previous two years.
Medicare Advantage Enrollment
| December Enrollment Counts | February Enrollment Counts | Variance | % Increase | ||
|---|---|---|---|---|---|
| Dec 2008 | 9,886,679 | Feb 2009 | 10,371,946 | 485,267 | 4.7% |
| Dec 2009 | 10,909,969 | Feb 2010 | 10,965,136 | 55,167 | 0.5% |
| Dec 2010 | 11,449,091 | Feb 2011 | 11,727,890 | 278,799 | 2.4% |
| Dec 2011 | 12,165,597 | Feb 2012 | 12,844,304 | 678,707 | 5.3% |
| Dec 2012 | 13,382,709 | Feb 2013 | 14,062,975 | 680,266 | 4.8% |
| Dec 2013 | 14,603,357 | Feb 2014 | 15,349,557 | 746,200 | 4.9% |
| Dec 2014 | 15,860,248 | Feb 2015 | 16,334,503 | 474,255 | 2.9% |
| Dec 2015 | 16,734,813 | Feb 2016 | 17,144,460 | 409,647 | 2.4% |
| Dec 2016 | 17,563,828 | Feb 2017 | 18,467,665 | 903,837 | 4.9% |
Based on these February 2017 enrollment numbers, CSG Actuarial is projecting that Medicare Advantage enrollment as of December 2017 will be 18.9 million (or 20.1 million if other Medicare “capitation” contracts are included).