Medicare Supplement claims have been trending up since the COVID-19 pandemic. We have seen an increase in the overall market loss ratios and have seen carriers reacting by applying for larger rate increases.
This article will summarize some of the emerging claim statistics that are driving the higher loss ratios that we are seeing on our clients’ Medicare Supplement Plan G blocks of business. Data for 2024 includes claims incurred through 6/30/2024 and paid through 1/31/2025. Since Plan G does not include coverage for the Part B Deductible, the normal pattern is for the covered claims to increase through the year. This means that the Part B claims will grow at a faster rate during the second half of the year and result in higher claim costs overall claim costs.
Note that these claim statistics are not normalized for underwriting wear-off, aging or any changes in demographic or geographic mix.
Claims by Benefit Type
The following table shows the breakdown of Plan G paid claims per policy by incurred year and benefit type. Results for:

Some key takeaways:
-
Part B claims account for 85% of claims in each incurred year.
-
Part A deductible claims are 10-11% of claims in each incurred year.
-
Overall claim costs grew by 25% in 2022 and 15% in 2023.
-
Experience for 2024 includes a partial year which results in lower growth rates.
Part B Claims by Primary Diagnosis
The next table shows the twelve diagnosis codes that generated the highest claim costs in 2023 along with the average claim cost per policy. These are split between ‘low frequency, high severity’ and ‘high frequency, low severity’ claim types.

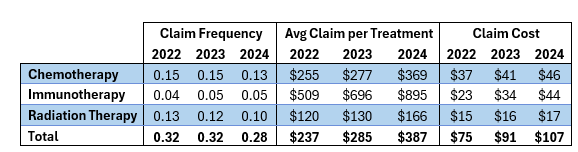
In this final table we will look at some of the trends in the three main types of cancer treatments (i.e., chemotherapy, immunotherapy and radiation therapy) that were included in the table above. Most cancers are treated with one or more of these types of therapies and the prevalence of cancers has been on the rise across different insurance populations. Within this table we are calculating the claim frequency as the number of paid claims divided by the number of policy year exposures.